A long time ago, in a galaxy seemingly far, far away from my home town, I began my journey as a college student studying electrical engineering in the small city of Gainesville, Florida. Late nights of studying, memorizing theory and endless supplies of coffee powered my battle through electrical engineering. It wasn’t until I started my first lab that things started to make sense.
After six short years later, I work at Texas Instruments (TI) as an applications engineer in power electronics. Upon starting, armed with some power electronics theory from college, I set sail for the laboratory. In my first few weeks, I realized the true power of electronics. While learning, I might have accidentally blown capacitors up, watched tiny flames engulf my MOSFETs and put my (developing) soldering skills to the test, shorting everything the sun touches. I enjoy challenges, so I asked myself, “How could I have been better prepared for this job?”
The answer, just as it was when I started college, was targeted lab work. Since power is a necessary part of every single electronic system (no power = no functioning technology), TI has released a kit aimed at arming students and professionals with the practical power knowledge for both basic power concepts and advanced design requirements. The package is called the TI Power Management Lab Kit (TI-PMLK), and I got the chance to try it out.
Unboxing
The buck kit (there is also an LDO, boost and coming soon, a buck-boost kit) came with a couple of items: a book with six experiments and a circuit board with two buck converter power supplies. The first thing I noticed was the board interface. There are lots of test points, jumpers, and available shunts, which could save lots of time when you want to make quick changes, but don’t want to spend time soldering.
The book’s preface explains the inspiration, purpose, and structure of the PMLK. The book provided is also available in a PDF format, should multiple people want to use it. The table of contents reveals the lab’s structure. It does a good job of isolating key information with small descriptions to avoid having to go back and forth through pages. The subsequent pages list the instruments needed, schematics with bills of materials (BoM), and connections for the two bucks. Now it’s time to experiment.
Getting Started
In order to start the first experiment, which focused on the impact of line and load conditions on efficiency, I headed to the lab to get my equipment set up. The book recommends a properly rated DC power supply, oscilloscope, electronic load and multimeters. However, if your lab set up does not come equipped with the equipment listed in the experiments book, there is also a cost effective test methods book which outlines how to perform the measurements using minimal or alternative equipment.
In order to make connections to the input and output terminal blocks, I cut some wire that my connectors could grab on to, and fastened them into the terminal blocks. All of the wire connections between the instruments and your buck converter are listed in the “Experiment Set-Up” page.
After establishing the connections, I read through the first section of the experiment, the “Case Study,” to begin. The case study summarizes the purpose of the experiment and what components we’ll work with. The “Theory Background” section lists useful formulas to compare theoretical calculations to experimental results later in the experiment. The “Preparation and Procedure” section guides you through a step-by-step on how to power up the board, load the circuit, and measure values.
Measurements and Calculations
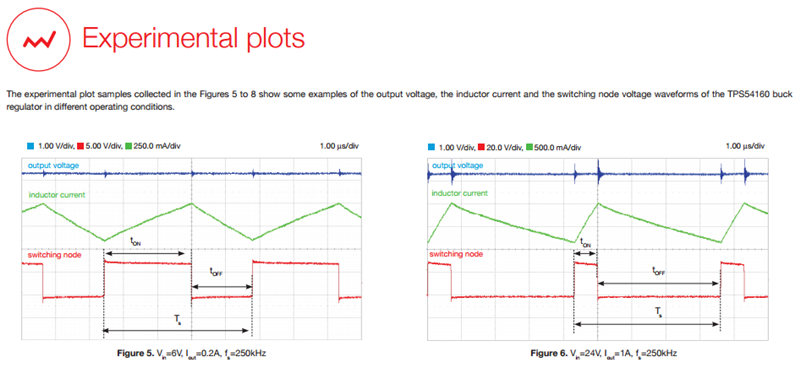
After following the steps, I obtained the switching waveforms on the oscilloscope, along with the voltages and currents at the inputs and outputs. The objective of the experiment was to vary the input voltage and load current to observe their impacts on system efficiency, switching waveforms, and inductor ripple.
Switching and Inductor current ripple waveforms are shown on the oscilloscope while the multimeters from left to right read output current, output voltage, input voltage, and input current
It was awesome to see theory come to life while measuring the switch node and current ripple, as it confirmed calculations and graphs seen in the classroom. After taking the measurements, the next step is to compare experimental results to the theoretical results. Armed with equations from the theory section and a TI-89 graphing calculator, I began calculating.
After completing the calculations, you are prompted with a few questions that are answered in the “Discussion” section later in the experiment. The experiment also provides some plots to that I could compare to mine, and does an excellent job of explaining the phenomena that I saw.
Overall, the TI-PMLK is an excellent tool for any student or professional. The experiments in the book cover many topics and challenges we see in industry today and relates that to the power supply performance trade-offs an engineer has to make to design it into a system. The kit stimulates interest with hands-on experiments and brings paper theory to life with practical engineering experience.
As a recent college graduate, I like that the TI-PMLK arms new engineers with the basic experience and tools you need when venturing into the world of power electronics. If you are a seasoned engineer, the TI-PMLK can also provide you with training to help make meaningful design decisions that improve size, cost and efficiency. Overall, I highly recommend the TI-PMLK and can’t wait to also test out the LDO and boost boards.


